
Speaking as a software engineer who is passionate about user experience, I’m always searching for tools to help me ensure I’m delivering the best possible customer-experience. An observability-driven approach can shine a light on web performance and its direct impact on customers.
Which Metrics are Important to Track?
Over the last few years, Google has been promoting a growing set of metrics it has developed for tracking web performance. Given they are promoted by Google, often these metrics are associated with SEO and improving conversion for AdTech platforms, but it turns out they are excellent user-centric indicators too.
In my opinion, the following are the most important metrics that directly relate to customer experience:
First Contentful Paint

First Contentful Paint (or FCP) is recorded at the first moment any content is rendered onto the screen. FCP is an important customer metric because streaming content onto the page early helps reassure the customer your page is still loading. An FCP below 4 seconds is considered moderate, and below 2 seconds is fast.
Largest Contentful Paint

Largest Contentful Paint (or LCP) is measured by the point at which the page’s largest element is rendered above the fold. Similar to FCP, LCP is an important user-centric metric because it indicates the main content has loaded and the page is useful. An LCP below 4 seconds is considered moderate, while below 2.5 seconds is fast.
Cumulative Layout Shift

Cumulative Layout Shift (or CLS) is tracked as the sum total of all unexpected layout shifts that occur on the page. An unexpected layout shift is any time an element changes its position on the page, for example when an image or video is loaded asynchronously, pushing the page content beneath it down. A CLS score below 0.25 is considered average, while a score below 0.1 is good.
First Input Delay
First Input Delay (or FID) happens when interactions occur while the browser is in the middle of a long running task. Browsers must finish running the active task before they are able to respond to any input, which can manifest in a delay that will make your site feel sluggish. Your FID score should ideally be below 100ms.
Okay, Show me the Tools!
The following is a list of tools I use regularly, or have used in the past which I recommend;
Lighthouse for Google Chrome
https://developers.google.com/web/tools/lighthouse
Google is the biggest promoter of its own web performance metrics, which should come as no surprise. As a result, they are committed to supporting surfacing these metrics in as many tools as possible.
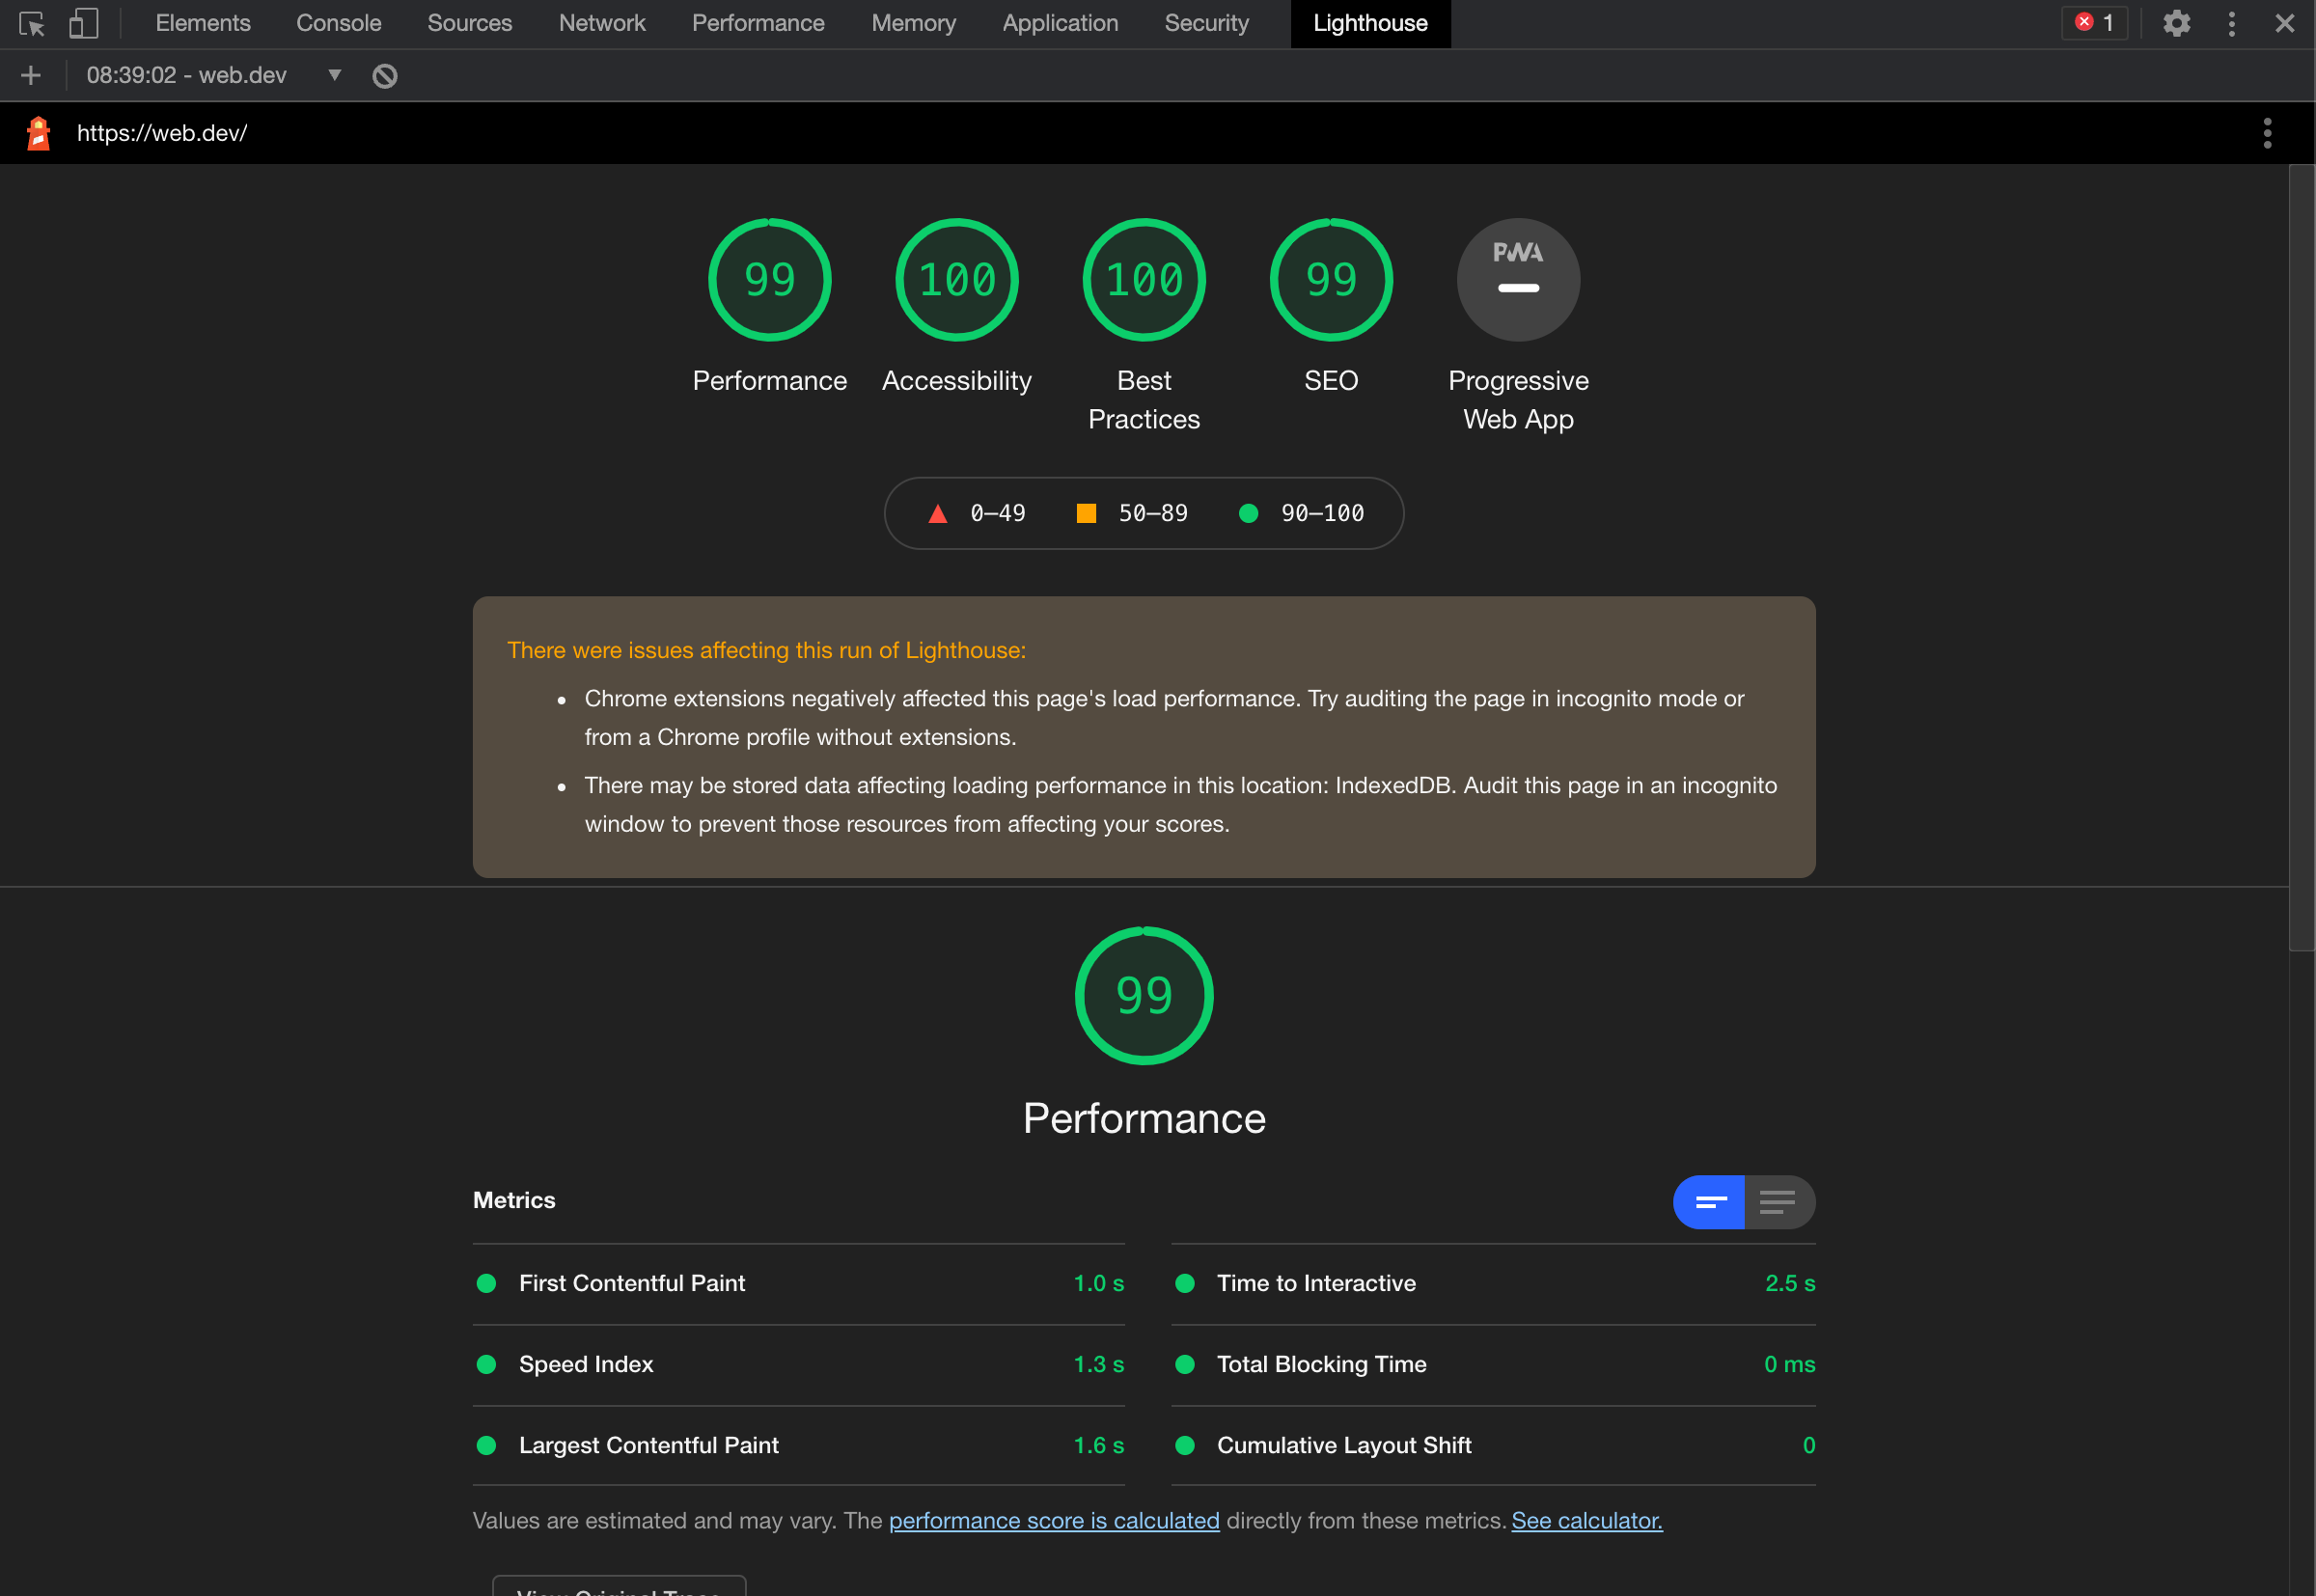
Where this originally started was a tool called Lighthouse, which is built into and can be run directly from Google Chrome. To access Lighthouse, open the Chrome Developer tools (likely by hitting F12 in your browser), and simply select the tab that says ’ Lighthouse ’.
Running web performance tests on your local development machine with an 8-core CPU and 32GB of RAM is unlikely to represent a real-world test when taking into account that over 80% of all web traffic comes from mobile devices on cellular networks. Lighthouse allows you to configure your tests to run on an emulated device mode that is a similar experience to using a mid-range mobile device over a 3G connection.
✅ Upsides: It’s likely you’ll already have Chrome installed and open. Running Lighthouse and generating a report takes only a few seconds.
⛔ Drawbacks: You can only run one test at a time, for a small selection of devices. You won’t be able to accurately measure the customer experience for customers in different parts of the world to you.
web.dev
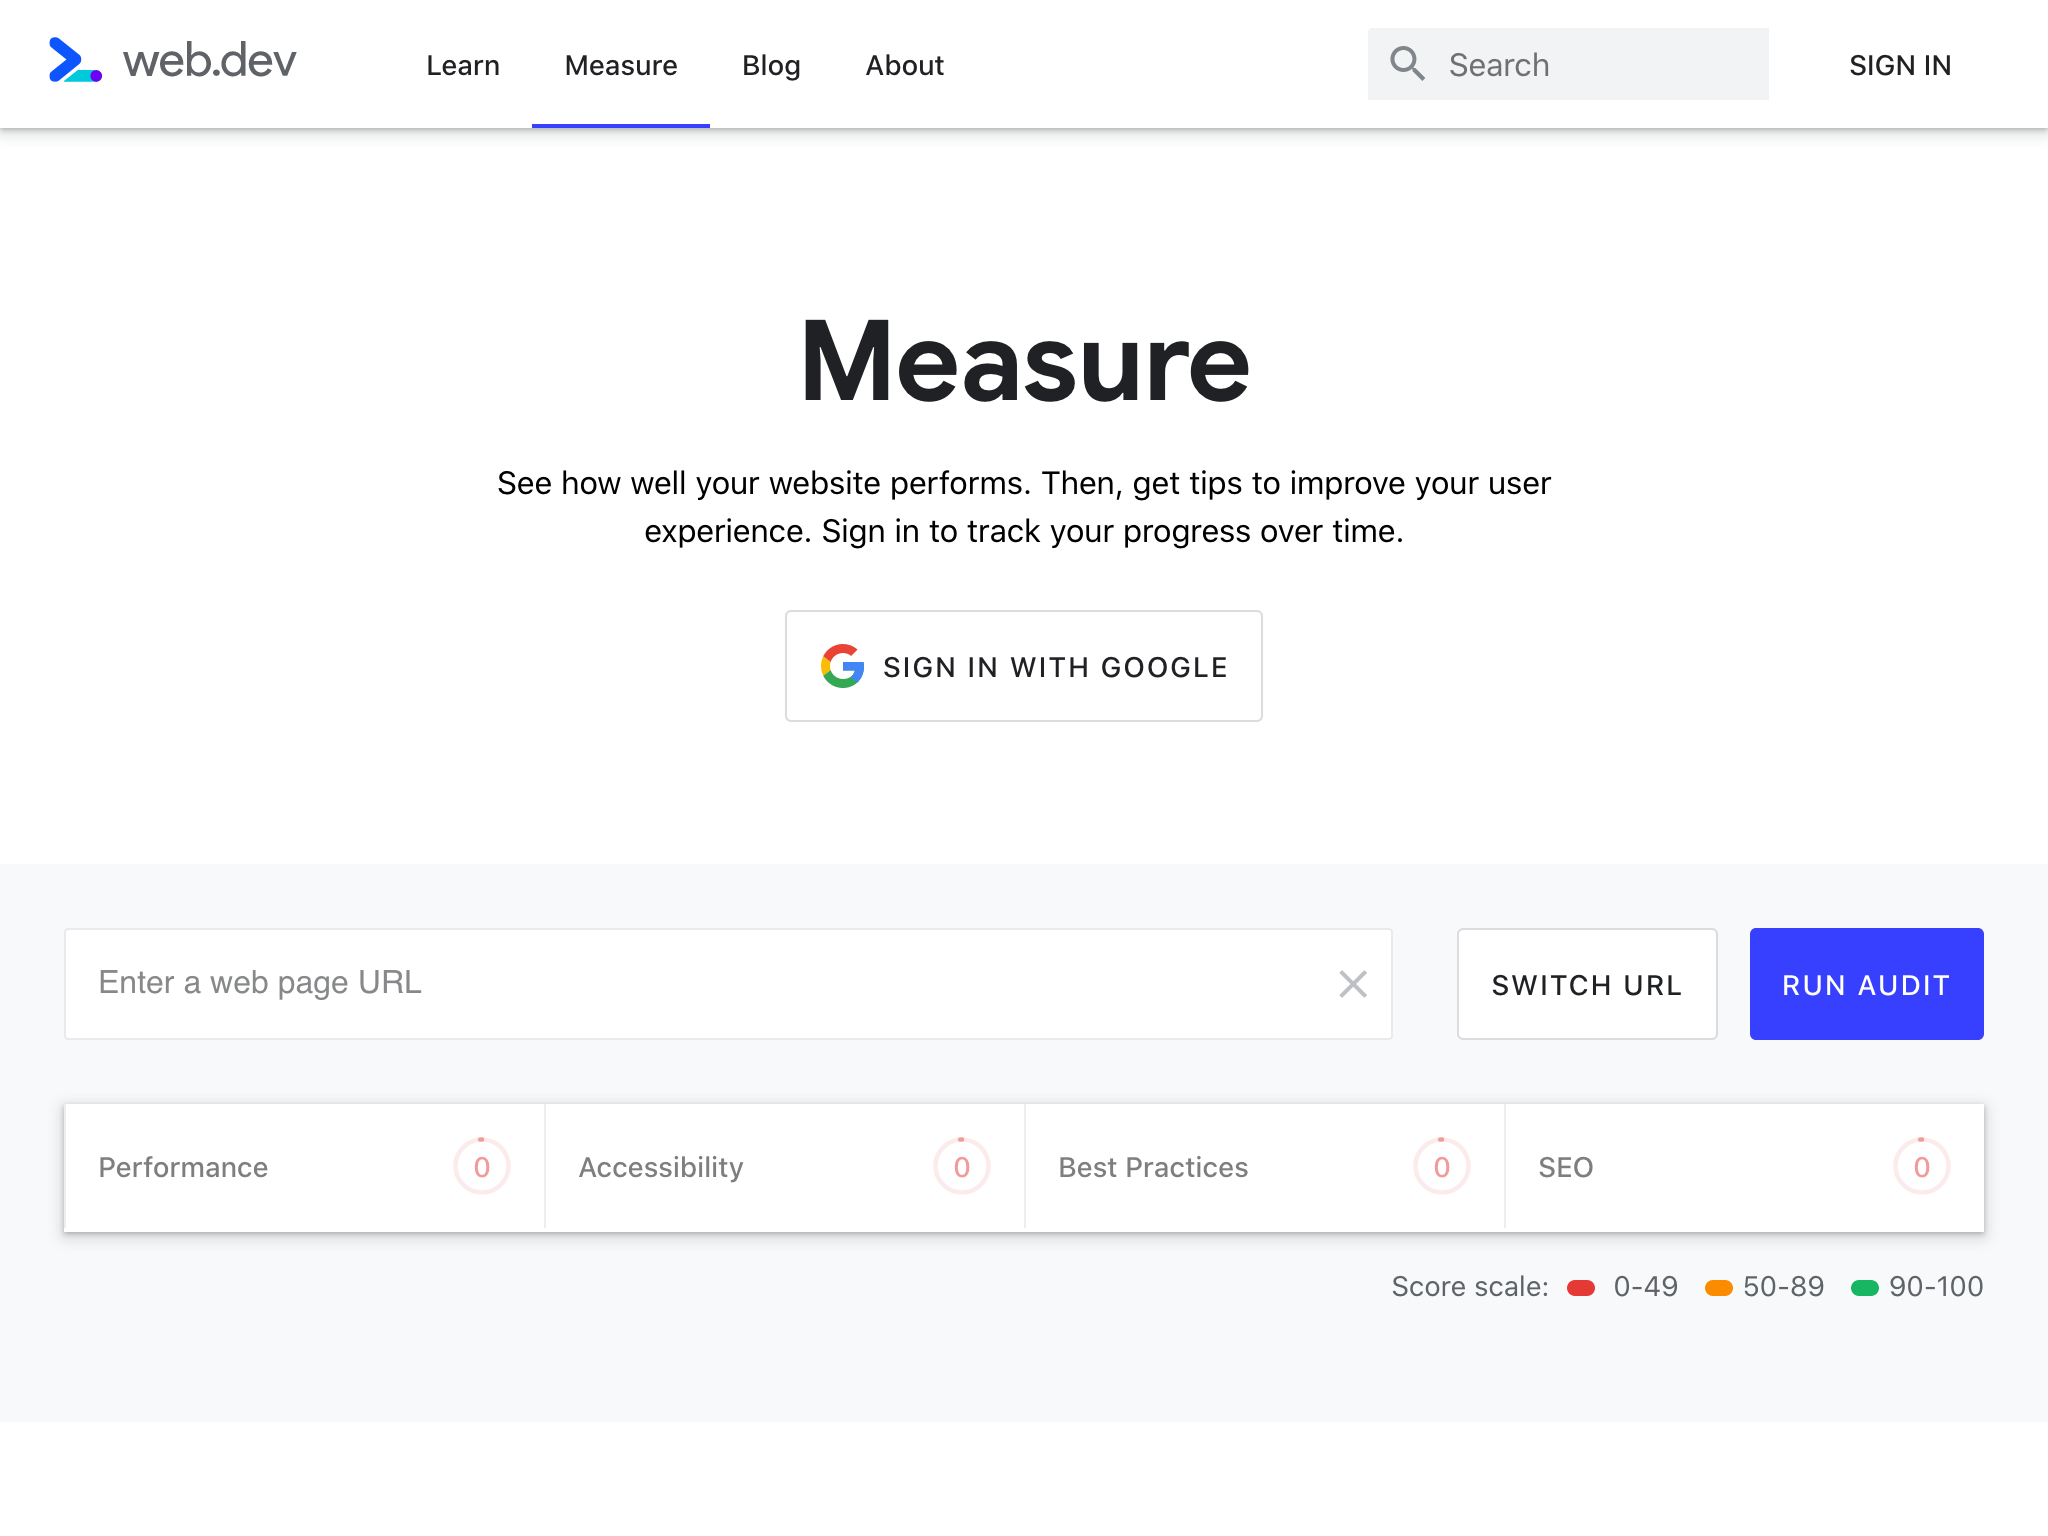
Based on Lighthouse, I primarily use this tool if I want to run a test in the context of a customer based in the US without observing the additional latency I experience being based in Australia.
✅ Upsides: Running this tool takes only a few seconds and can generate a report that can be sent as a link. Good option if you really don’t want to install Google Chrome.
⛔ Drawbacks: You can only run one test at a time for a specific type of mobile device. You can use this tool to gauge web performance for customers in other parts of the world, but only if that customer is in the United States.
KeyCDN Tools
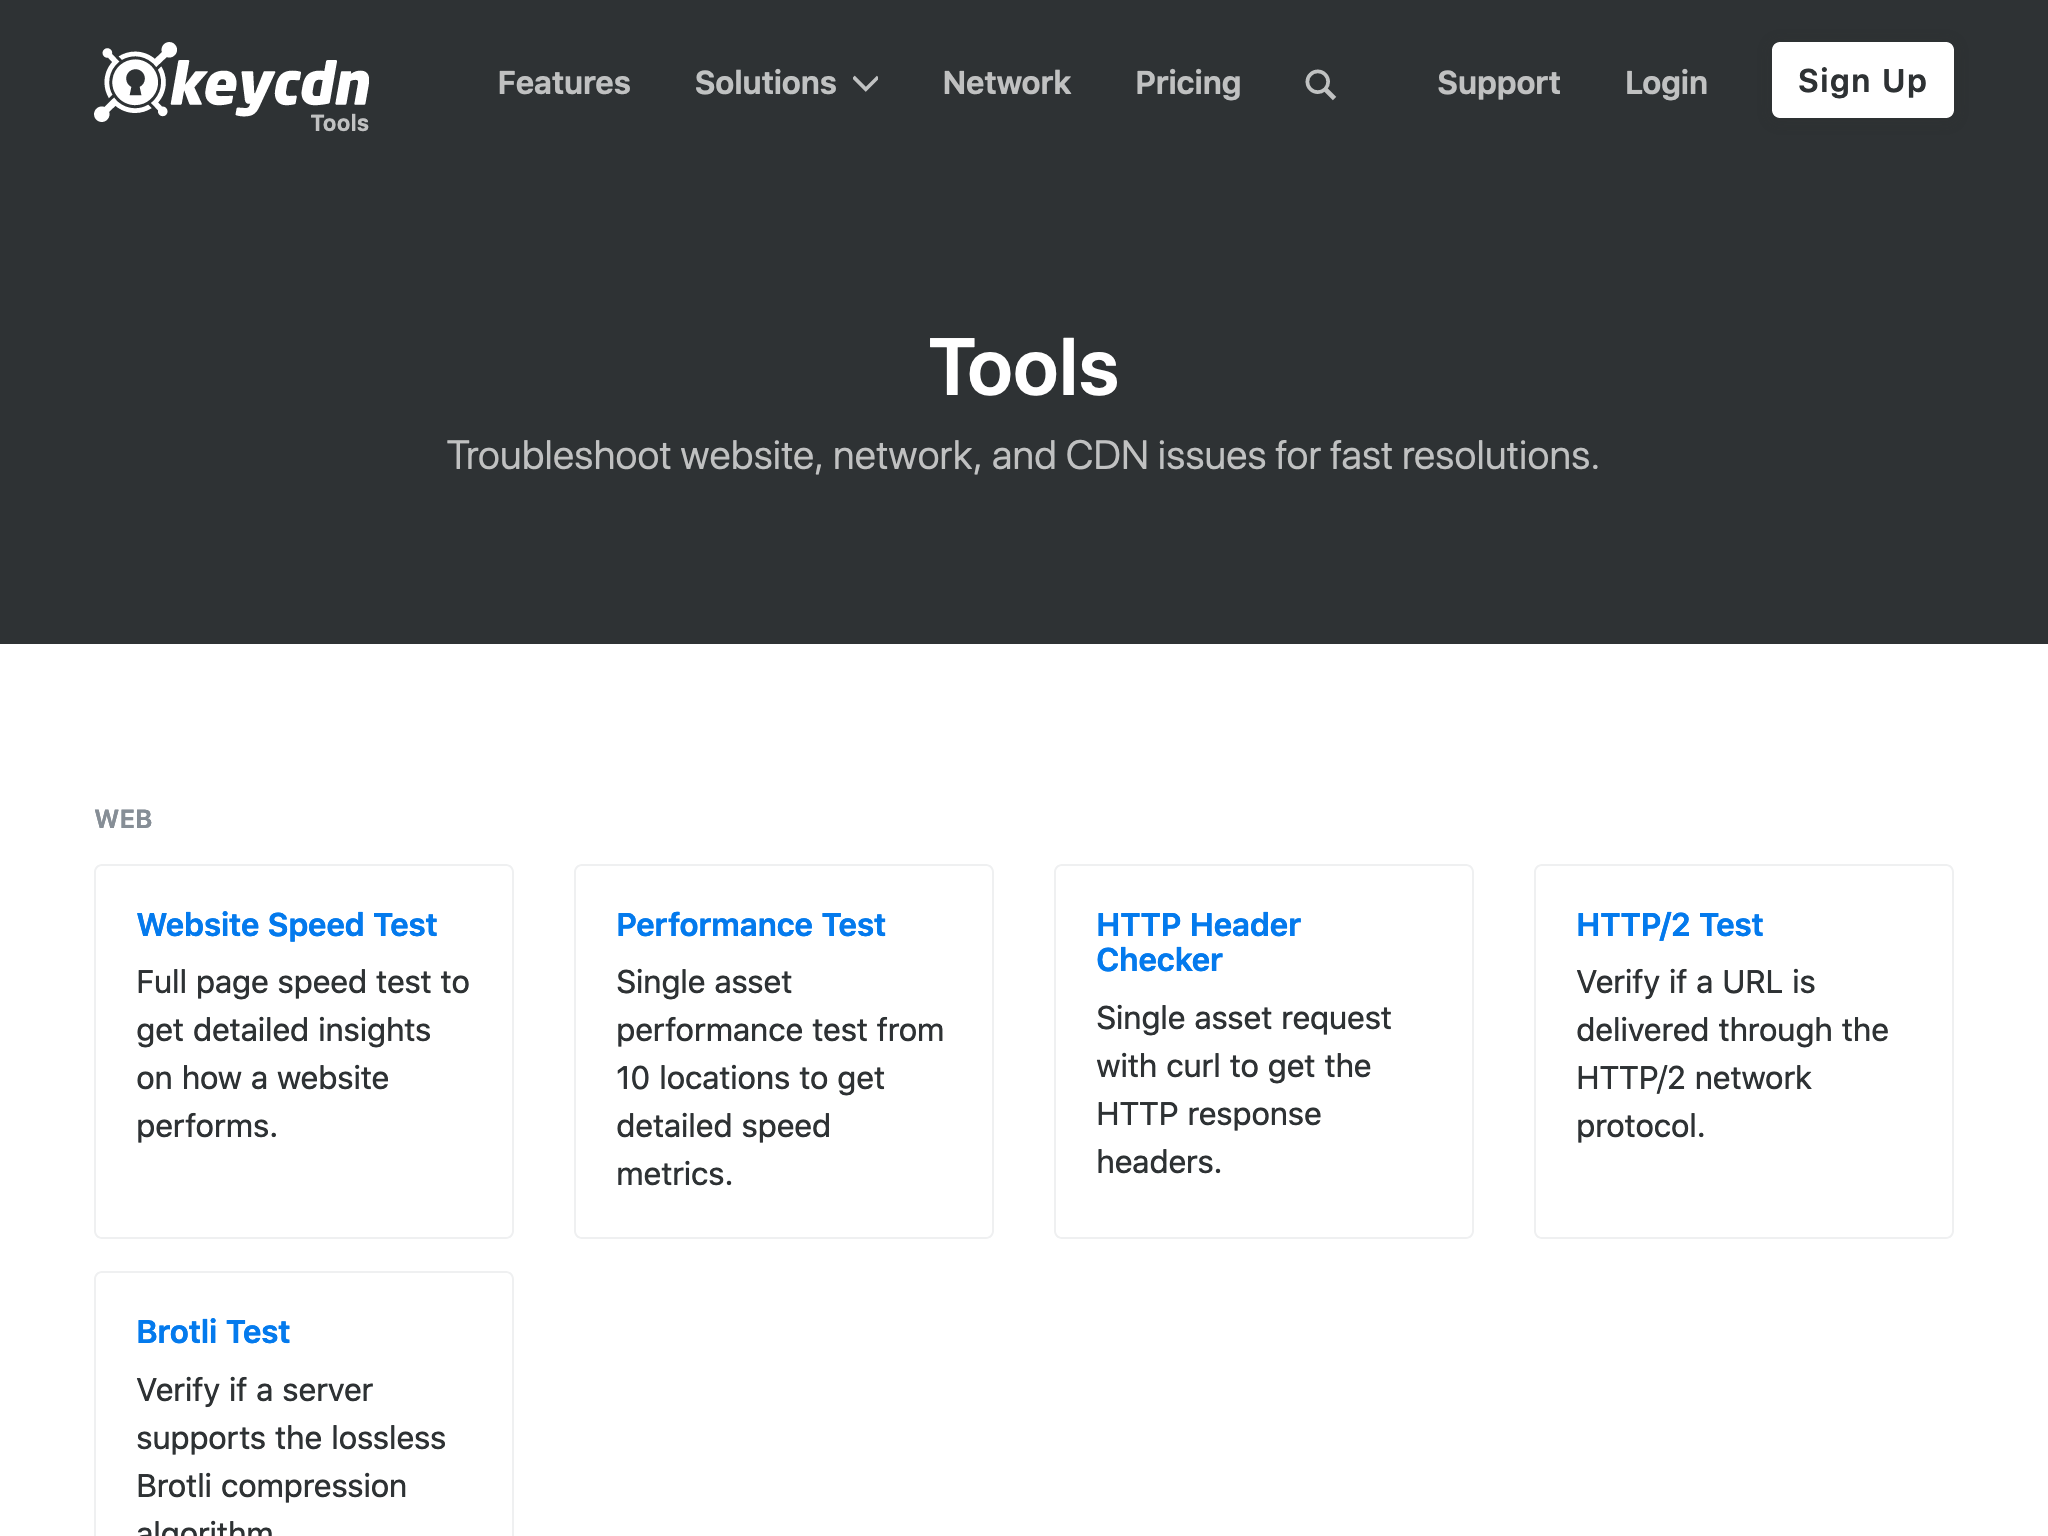
KeyCDN Tools is a powerful suite of free tools that can test for a wide variety of detailed technical metrics that can help diagnose web performance issues. It allows tests to be run from a variety of locations, to help understand the customer experience for a worldwide audience. I use this tool to dive deeper when I’m trying to solve particular performance issues that require additional data.
✅ Upsides: A broad set of useful tools for tracking detailed technical metrics that might help diagnose and improve your customer experience.
⛔ Drawbacks: While this tool is free, there are API limits that prevent you from running the tools too often.
Calibre
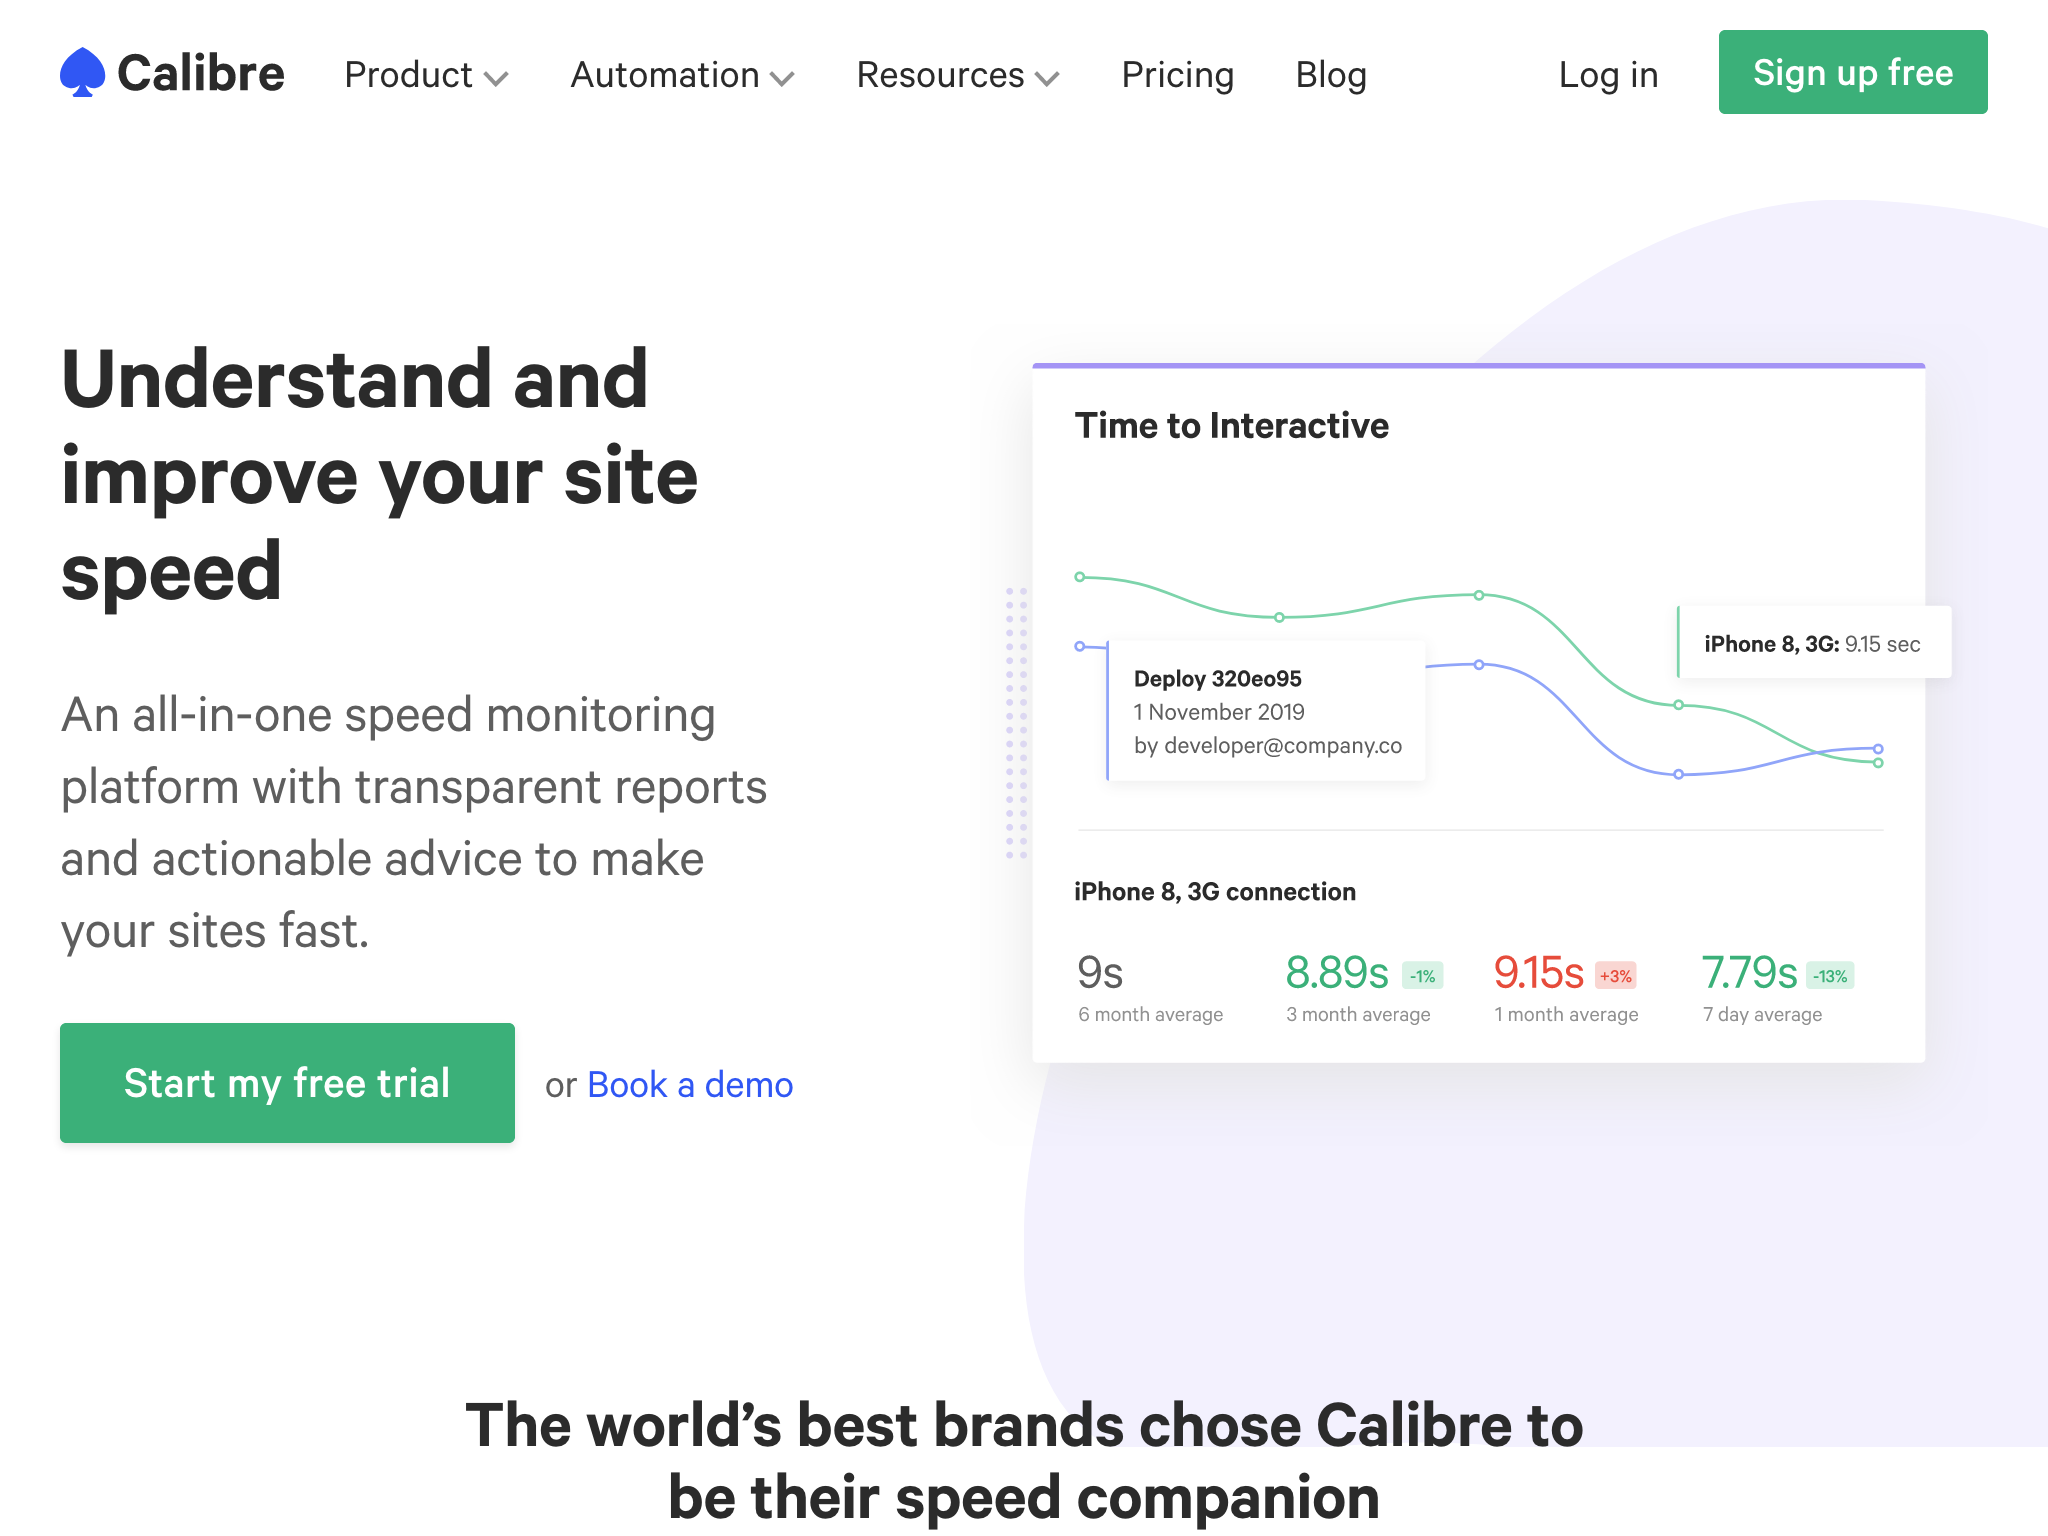
Calibre is another Lighthouse based tool that is specifically designed with a focus on tracking continuous web performance data to analyse patterns and trends. Calibre has a focus on automation and can ensure that web performance metrics do not regress over time.
Calibre has an impressive spectrum of test profiles for different devices, locations and connection speeds. It’s also the only tool I know of that has test profiles for browsers with Ad-blocking or fingerprinting protection enabled (acknowledging an ever-growing segment of the market).
✅ Upsides: Calibre offers automation of tests on a continuous schedule or integrated into your deployment pipeline. Tests can be set up to run from different locations and in a wide range of configurations that allow you to track performance for different types of customers. You can create a performance leaderboard by regularly testing your competitors.
⛔ Drawbacks: This is paid software as a service unlike the previous examples. In my opinion the price for this service is very reasonable, and they do offer a 15-day free trial.
CrUX Dashboard
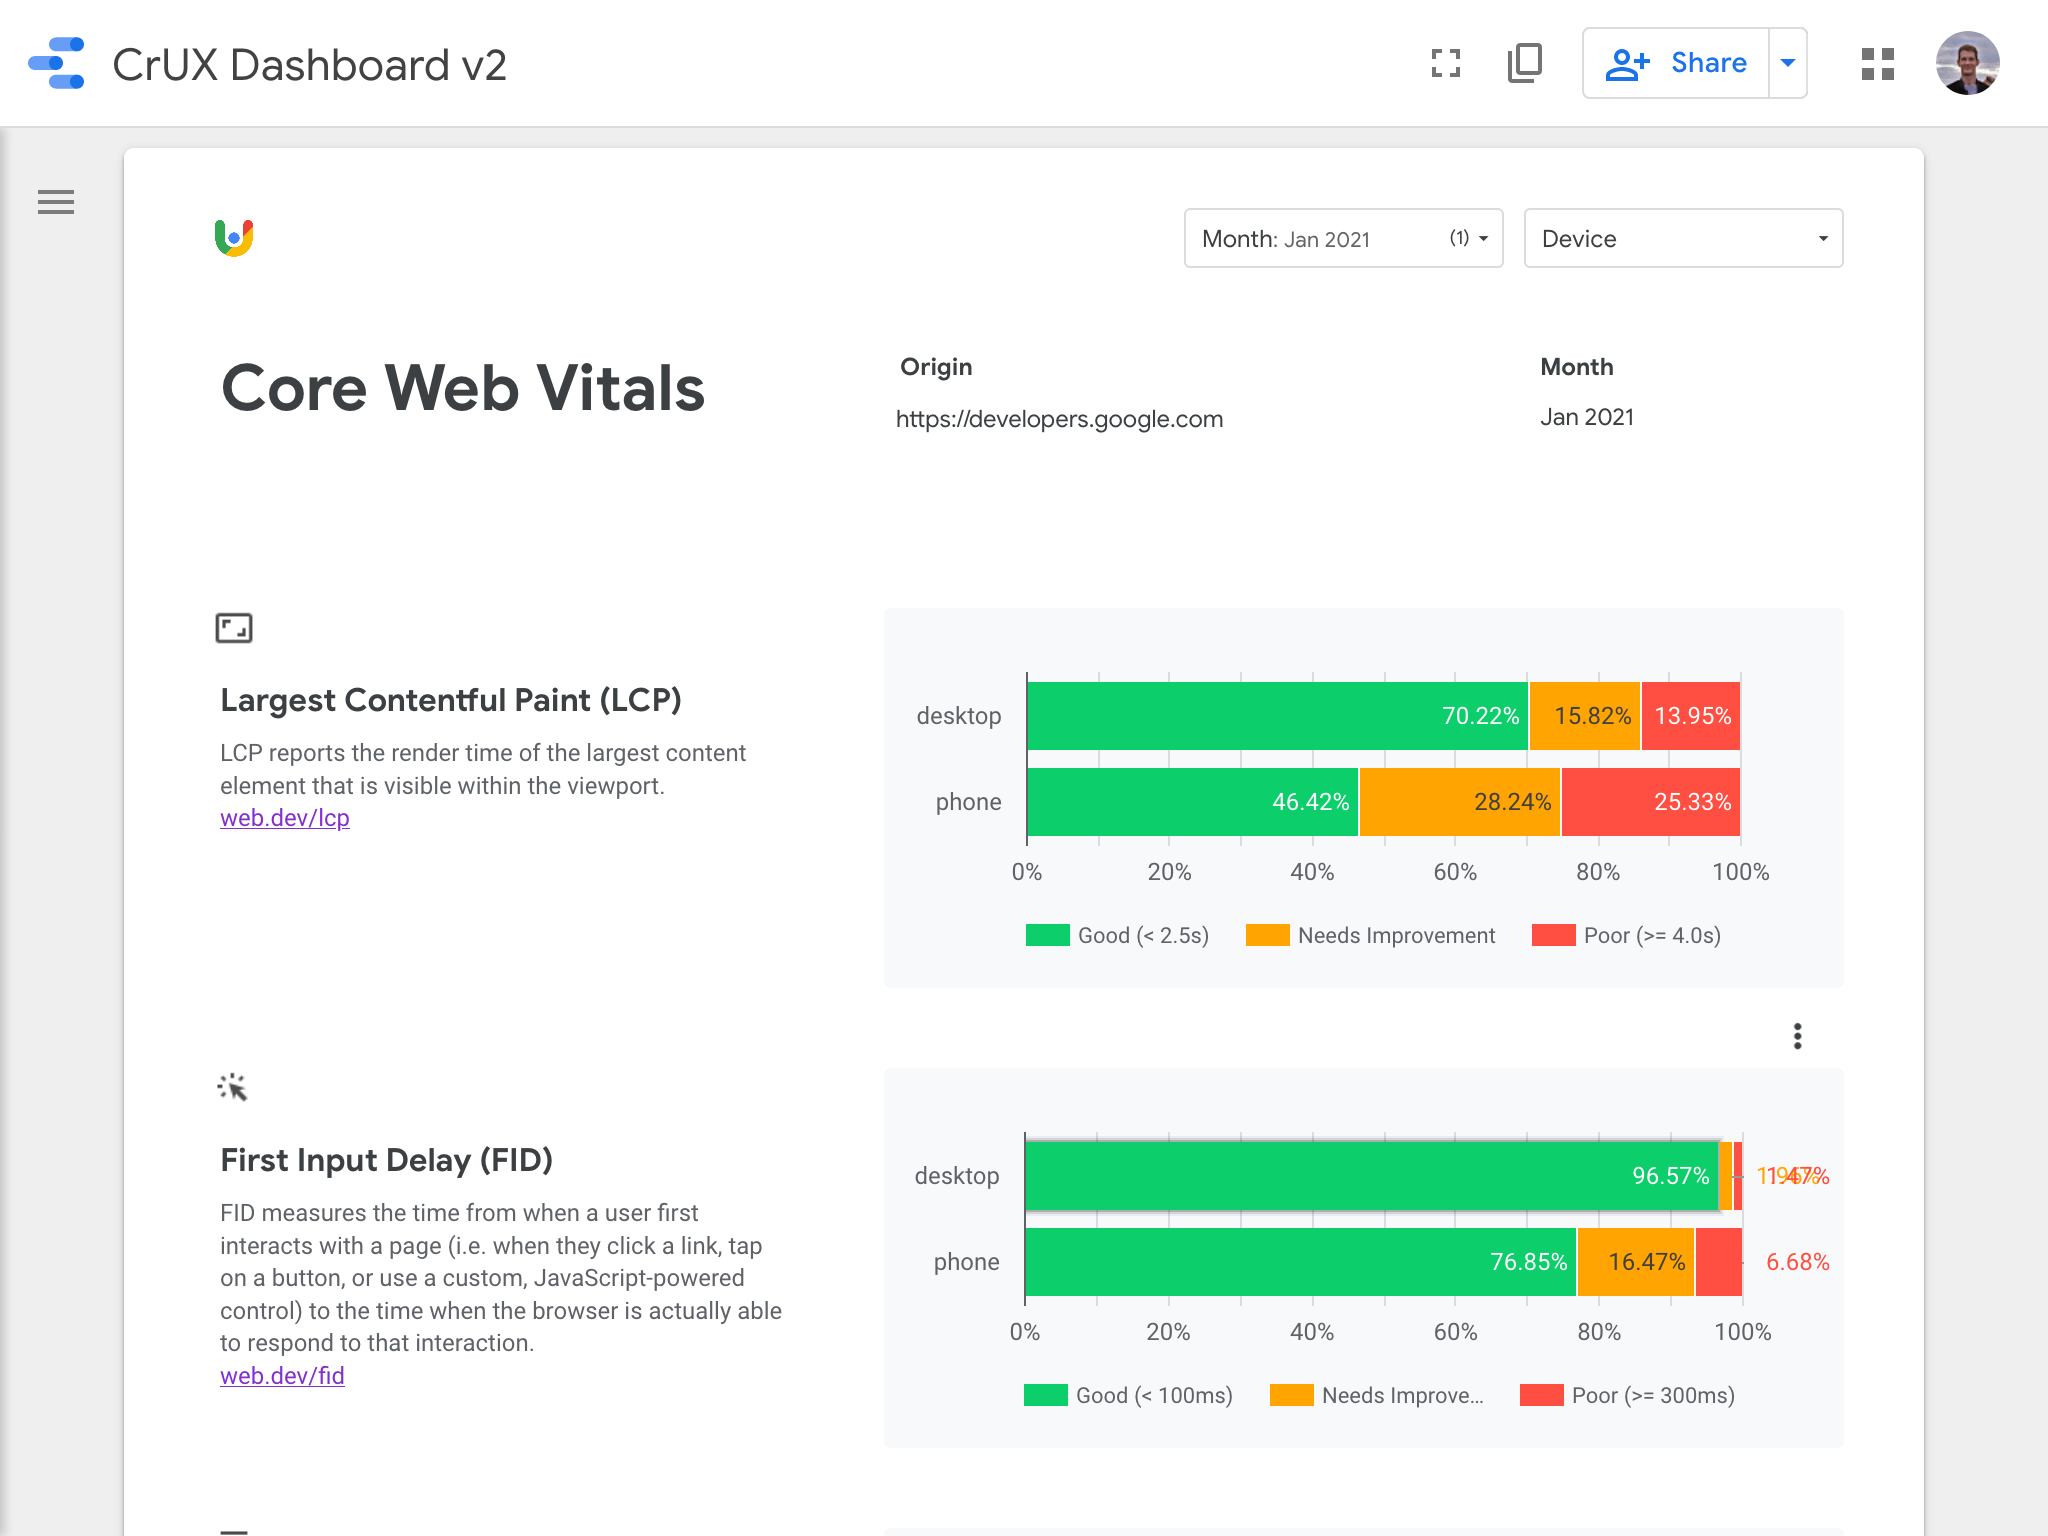
Data sourced from real-world user traffic will always be more valuable that data from one-off tests that run inside a vacuum.** The CrUX Dashboard**is built from data aggregated from real-world user traffic reported by the Google Chrome browser.
Google Chrome records, anonymises and aggregates data from real users and makes that data available at the end of the month in a free report. This report provides an excellent way to visualise performance trends over longer periods of time, although it does come with the downside of having a much longer feedback loop.
✅ Upsides: Based on aggregated data from real user traffic, rather than emulated environments. Also completely free.
⛔ Drawbacks: The feedback loop is very slow - results are monthly and are made available nearly two weeks after the end of the month. Only captures data from Google Chrome.
Next.js Analytics
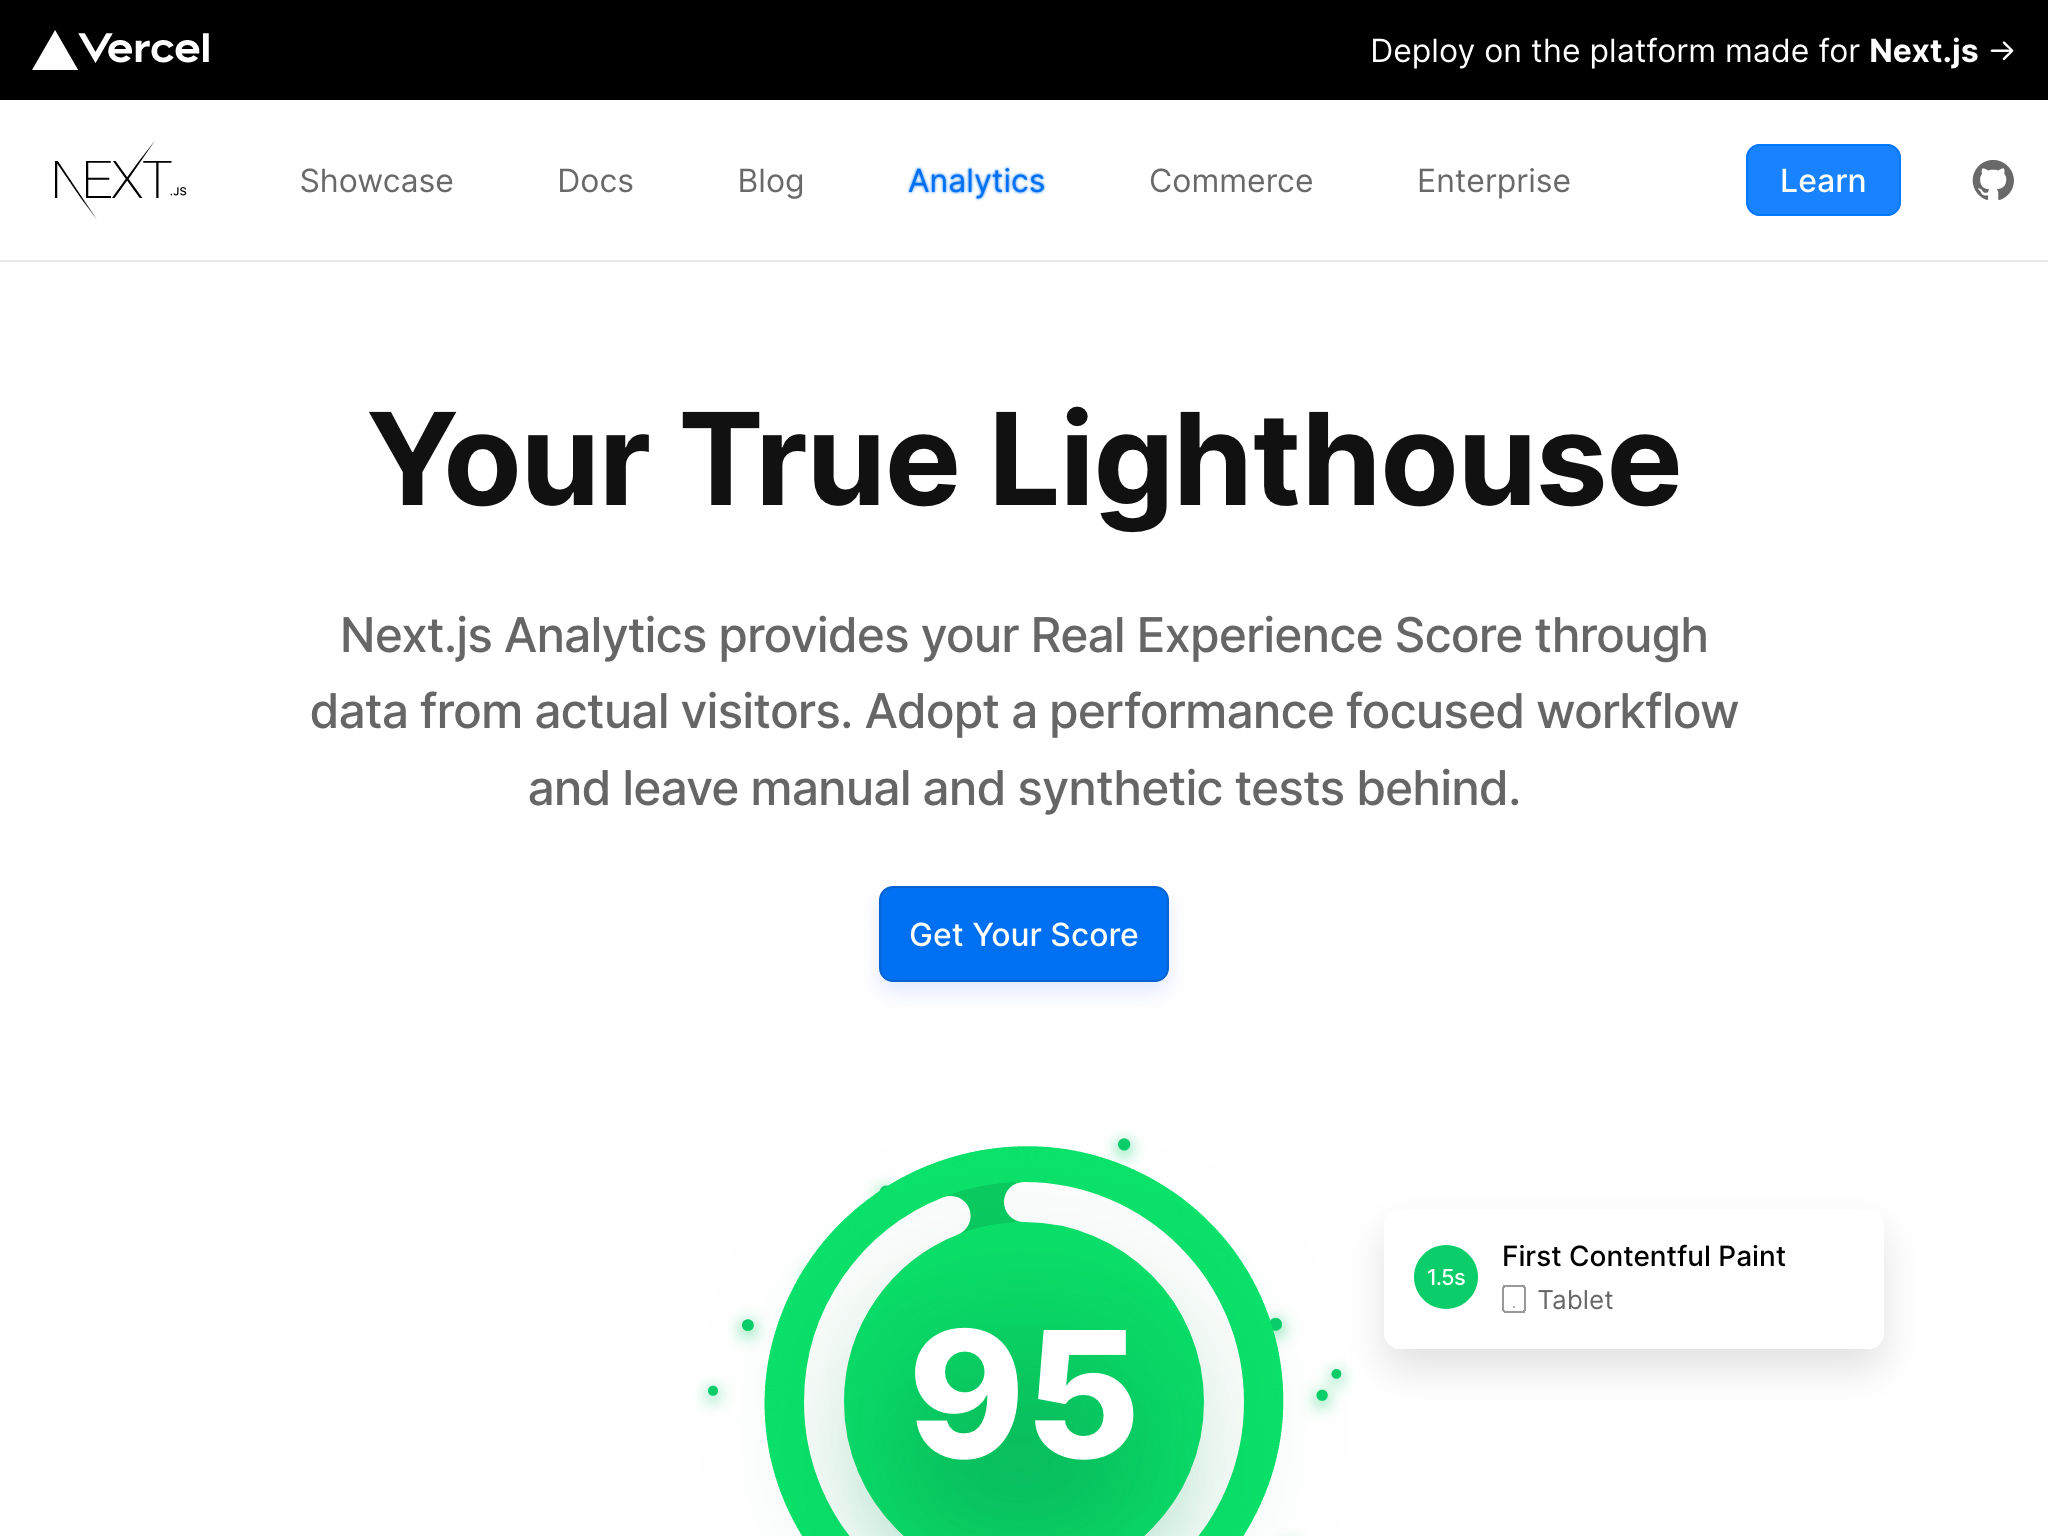
If you’re using Next.js and Vercel, you can setup Next.js Analytics- a tool that utilizes real-world user traffic to provide their own “Real Experience Score”. Unlike the CrUX report, Vercel aggregates and reports this data back to you with a much shorter feedback loop.
✅ Upsides: Based on aggregated data from real user traffic, rather than emulated environments. Super-easy to set up if you’re already running on Next.js and Vercel.
⛔ Drawbacks: Only supports the Next.js framework and is trickier to setup if you’re not using Vercel.
Web Vitals
https://github.com/GoogleChrome/web-vitals
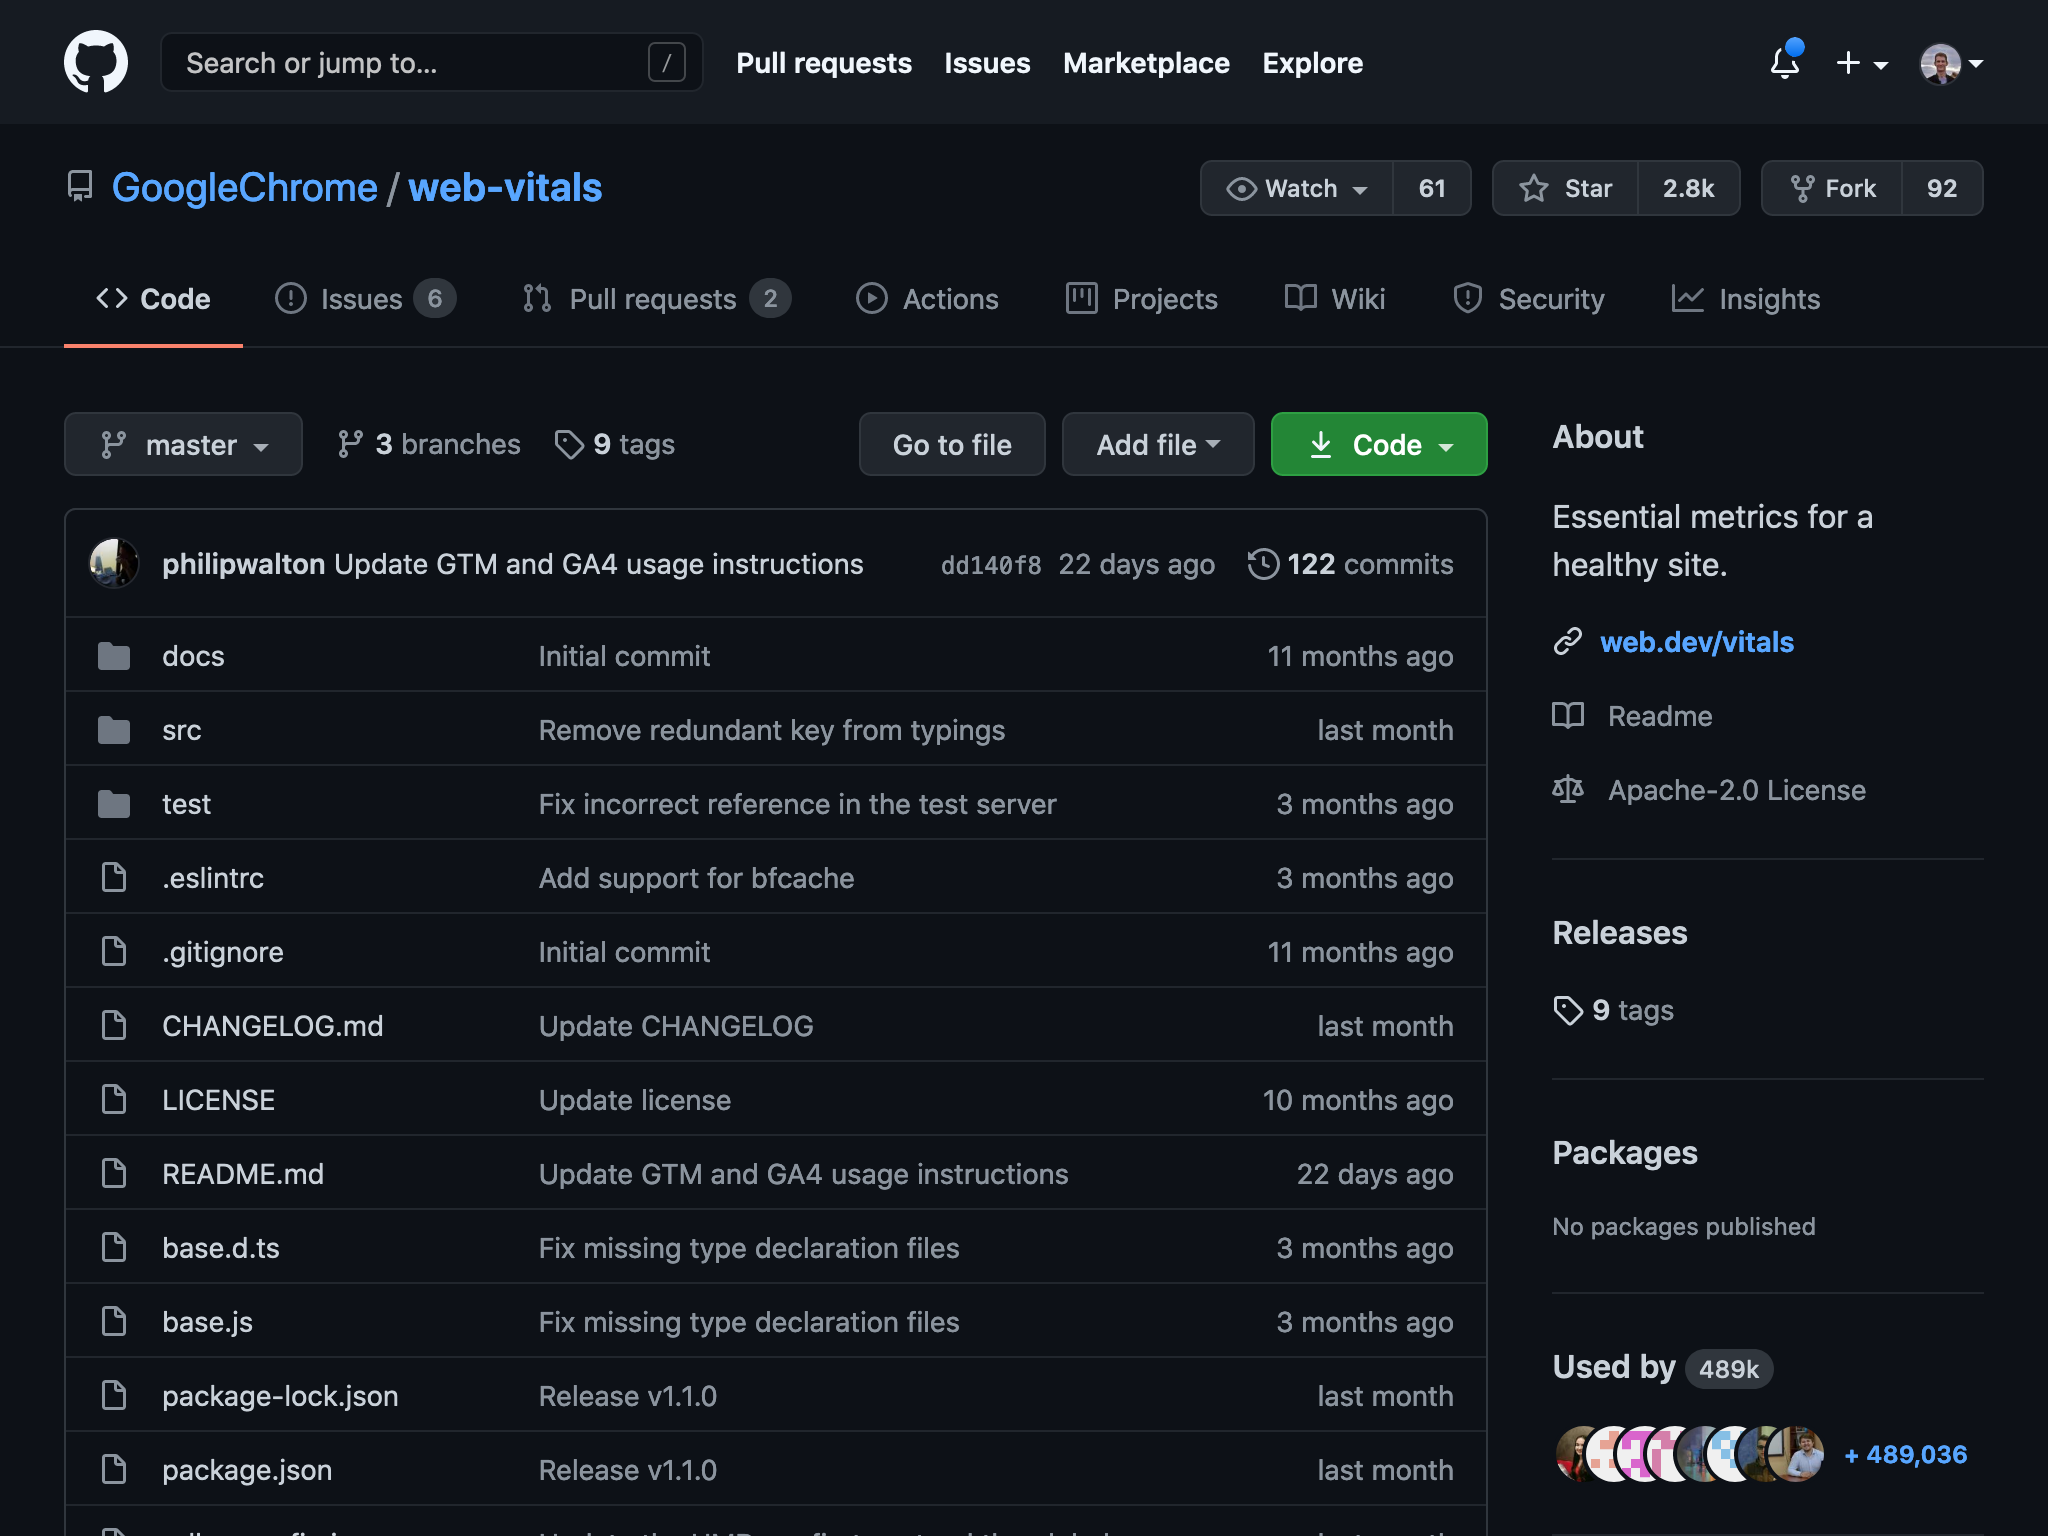
Lastly the most advanced option, the web-vitals javascript library. Using this option will give you more flexibility to use your preferred frameworks and other tools, but requires far more additional work to set up (if you do a bit of digging, you’ll find that Next.js Analytics is using this library under-the-hood).
✅ Upsides: Flexibility - allows you to set up your own web performance tracking with any framework and using your own tooling.
⛔ Drawbacks: This tool is not wholistic, it needs to be paired with additional software in order to record the metrics over time or produce dashboards. Also, not all browsers support the metrics.
Additional Resources
Learn more about tracking and improving web performance from Google’s official Web Developer portal.
The Calibre blog regularly posts well-researched articles about web performance.